General Statistics
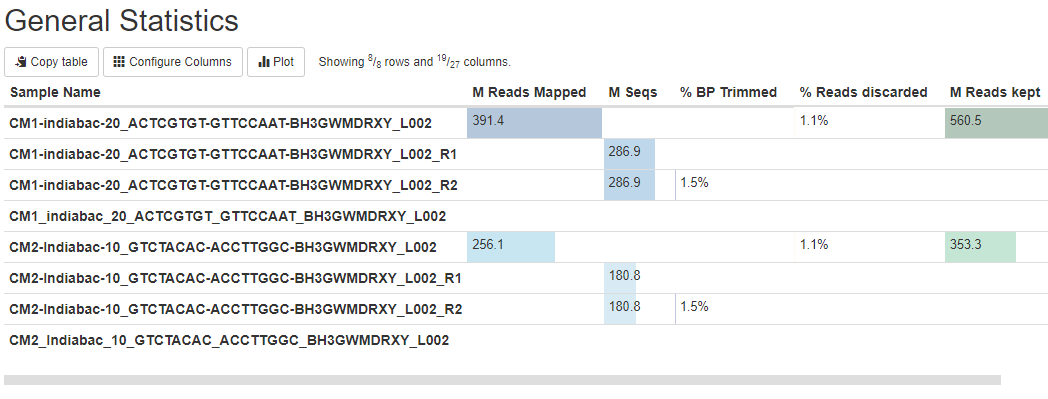
At the top of every MultiQC report is the 'General Statistics' table. This shows an overview of key values, taken from all modules. The aim of the table is to bring together stats for each sample from across the analysis so that you can see it in one place.
Hovering over column headers will show a longer description, including which module produced the data. Clicking a header will sort the table by that value. Clicking it again will change the sort direction. You can shift-click multiple headers to sort by multiple columns.
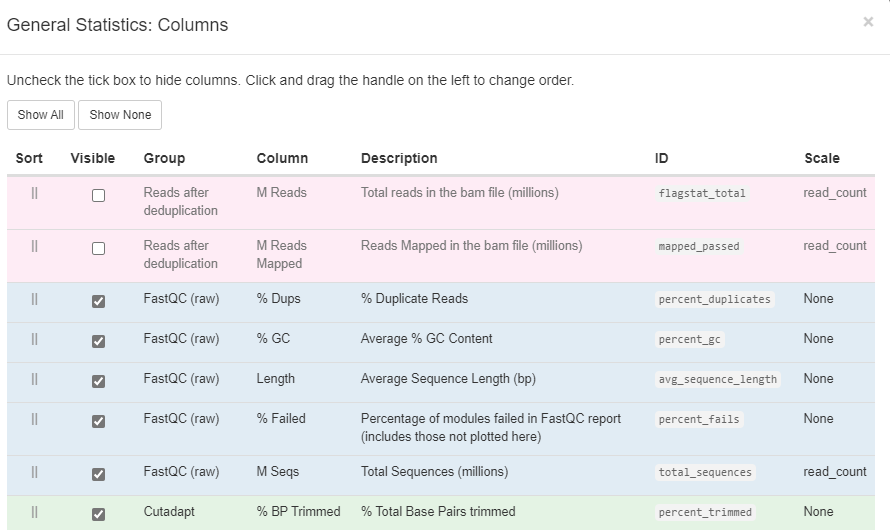
Configure columns
Above the table there is a button called 'Configure Columns'. Clicking this will launch a modal window with more detailed information about each column, plus options to show/hide and change the order of columns.
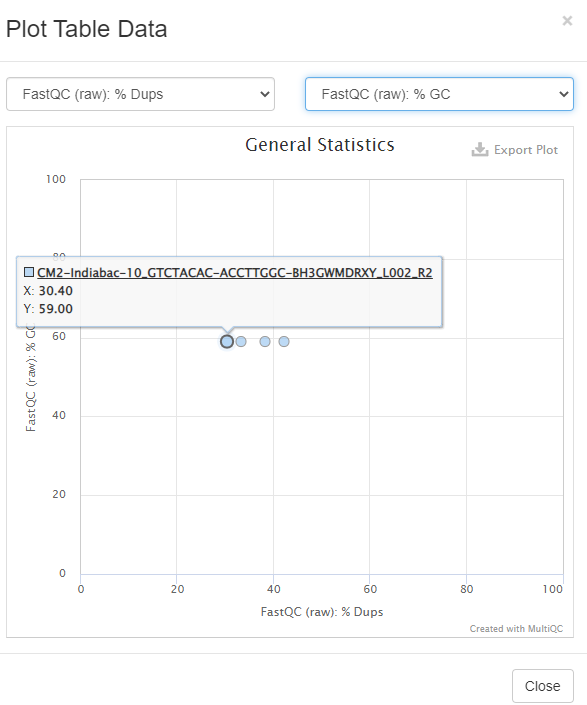
Plot data
The button 'Plot' allows to plot two columns one against the other if the sample name are the same.
The button 'Copy table' copies the table in tabular format than you can paste in a text or tabular file.
Warning
Remember to scroll to the left to see all columns displayed.


