Per sequence GC content
GC content for each run position.
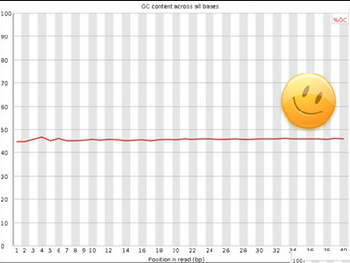
In a random library, you can expect there to be little or no difference between the different bases in a run, so the plotted line should be roughly horizontal. The overall GC content should reflect the GC content of the underlying genome.
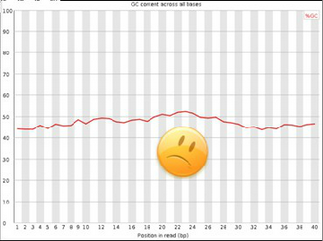
If you see a bias that changes for different bases, it could indicate an overrepresented sequence and therefore contamination of your library. A consistent bias across all positions indicates either that the original library was biased or that there was a systematic problem during library sequencing.

Warning
This module issues a warning if the GC content deviates by more than 5% from the average GC content.
Failure
This module will fail if the GC content deviates more than 10% from the average GC content.
Common reasons for warnings
The line in this plot should run horizontally across the graph. A ponctual bias is an overrepresented sequence which is contaminating your library. A consistent bias across all bases is a biased original library or a problem during sequencing of the library.

Good data: Nice and smooth distribution, no variation across read sequence.

Bad data:
- Variation across read sequence.
- Spike around 40% indicates that sequences with 40% GC-content are overrepresented in your sample.