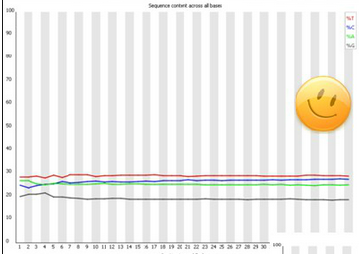
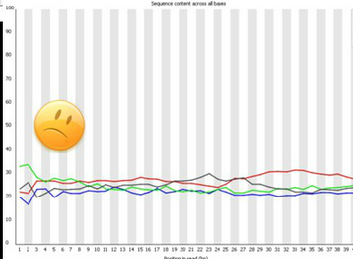
Per base sequence content
Analysis by base along each sequence

Clic on one sample to see bases along each sequence:

Each of the 4 DNA bases is normally found with about the same percentage (little or no difference between bases) as the sequence is read.
Therefore, the lines on the graph should be parallel to each other. The relative amount of each base should reflect the overall amount of these bases in your genome, but in any case there should not be huge imbalances from one another.
If there is an imbalance between the different bases, this usually indicates that a sequence is overrepresented and therefore your library is contaminated. If this bias is consistent across all bases, it indicates either :
- that the original library was biased,
- or that there is a systematic problem during the sequencing of the library.
Warning
This module issues a warning if the difference between A and T, or U and C is greater than 10% in any position.
Failure
This module fails if the difference between A and T, or U and C is greater than 20% in any position.
Common reasons for warnings
 Good data:
- Smooth overlength: the lines run parallel with each other.
- Organims dependant (GC content)
 Bad data: Sequence position bias.