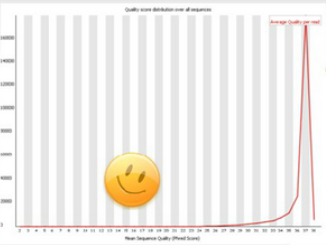
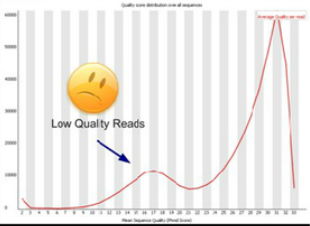
Per sequence quality scores

This graph allows you to evaluate the average quality of your sequences. If the average quality of the run impacts a small percentage of sequences, the distribution will be correct (acceptable error rate). If not, it means that there is a specific problem that you will need to determine.
Warning
A warning is issued if the average most frequently observed quality is less than 27 - equivalent to an error rate greater than 0.2%.
Failure
An error is triggered if the average most frequently observed quality is less than 20 - equivalent to an error rate greater than 1%.
Common reasons for warnings
Good data : most are high-quality sequences.

Bad data: not uniform distribution

TODO: Change images !